When modelling linearly varying pressure on a surface, there are two common approaches: Soil/Hydrostatic Pressure and Variable Surface Load. In some cases, Soil/Hydrostatic Pressure is the more intuitive choice, for example when you know the pressure increase per metre. In other cases, Variable Surface Load is easier to use, for example when you know the load values at the corners and want to define the variation directly from them.
This article first explains how to use Soil/Hydrostatic Pressure, how to enter the input values, and how to verify that the resulting load matches your intention. After that, Variable Surface Load is presented as an alternative method for cases where you want to define a custom linear variation manually.
Soil/Hydrostatic Pressure
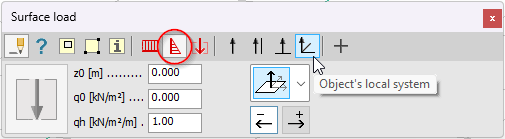
Use this option when the pressure should vary with depth, for example to represent soil pressure or hydrostatic pressure. Instead of defining the load as a skew plane through three manually chosen values, the program calculates the load intensity automatically from the global Z position of the loaded surface.
How the input works
The load intensities are calculated automatically from three values, which makes this method efficient when the pressure should follow the height of the structure rather than a manually defined skew plane.
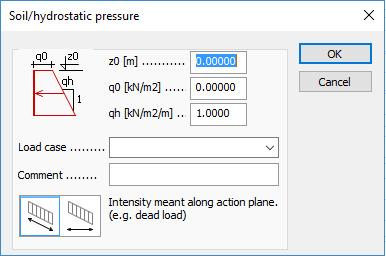
At any point on the loaded surface, the pressure is calculated from the point’s global Z coordinate together with the values of z0, q0, and qh.
- z0 is the reference level (on the global Z axis) where the soil or water surface is located.
- q0 is the load intensity at the surface level
- qh defines how much the pressure changes per unit length along the global Z axis.
The load intensity at a given point is calculated as follows:
q=q0+(z0-z)∙qh
q: the intensity of the load at the particular point
z: the Z coordinate of the point
How to check that the load is correct
A good practice is to review the load display and confirm that the pressure varies in the expected direction and with the expected magnitude. In Quick tools, open Display settings from the gear icon and enable Load value so the load intensity is shown directly in the view. Note that the graphical load representation is schematic by default. If you want to see the variation with correct proportionality, you can enable Display proportionally under Quick tools > Detailed settings > Static loads > Graphical options. If needed, use the Info tool to inspect the resultant force and its position. This helps verify that the load definition matches the intended physical situation.
Variable Surface Load as an alternative
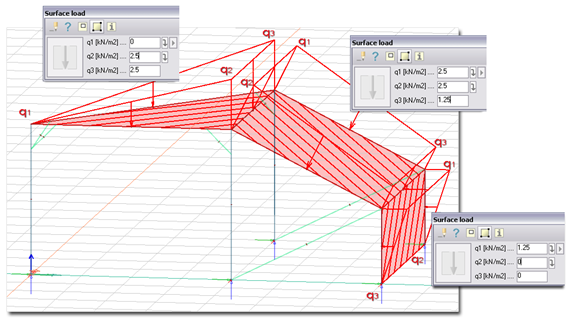
If you want to define a custom linear variation manually, Variable Surface Load is the better option. In that method, three intensity values define the load as a skew plane, which gives more manual control but also requires more interpretation from the user.
In practice, Soil/Hydrostatic Pressure is often the clearer choice when the load should vary with depth, while Variable Surface Load is useful when you need a manually controlled planar variation that does not directly follow the soil or water level.